May 10, 2009

Graduated!

Micro/Macro has fulfilled one of its purposes: helping me graduate!

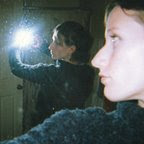
This slightly blurry photo was surprisingly one of the clearest from where my husband sat in the audience. In this one, I was waiting for the program director, Scott Barrows, to introduce the class of 2009. In fact, only two of us walked. The other girl's last name started with R, and mine starts with L, so I was before her. The College of Applied Health Sciences was the first to be called, and within that, Biomedical Visualization. So I was the first person to be called!

I am never first. My last name, Luther, is right in the middle of the alphabet. Before that, it was Lierl, which is pretty much the same, alphabet-wise. So I was a little uneasy. But I only malfunctioned a little. I walked a little too far, and they had to sort of re-position me in order to put my hood on. I guess it could have been worse.

Anyway, my life as a student may be over, but Micro/Macro will continue to grow and live. Some new possibilities have been suggested, which might allow me to profit from all of my hard work. I will be sure to investigate these, and keep you posted!

Apr 28, 2009

Fixed

Eventually, by ignoring the misleading example code and forgetting all about the confusing way they explained it, I got my SWF to dynamically resize within the browser window, embedded in html. Ironically, this is what it was doing before I went to the trouble to embed it in the html page in the first place, but if I had not, there would have been no way to be sure that the visitor has the appropriate Flash Player version (see previous post).

Anyway, in case you were wondering, or ever need to know for one of your own projects, here is what I did:

Inside the Flash, do this:
stage.scaleMode = StageScaleMode.SHOW_ALL;

Inside the code generator, choose 100% width and height. Put this in the style tags inside the head.

HTML, BODY, DIV { width:100%; height:100%; margin:0px; padding:0px; border:none; overflow:hidden}


And you're done!

Apr 25, 2009

Finishing touches

Immediately after beginning to show Micro/Macro to a lot of different people, some issues came to light. As a perfectionist, each issue freaked me out substantially, but most of them I've been able to move through. But sometimes the solution only creates new problems, and it’s hard to tell whether it was worse before I “fixed” the problem, or if it’s worse now! It seems like there will be no end to these last-minute details.

Admittedly, some of them are relatively minor. For example, a couple of people mentioned that it was hard to roll over the smaller structures in the “Organelles” tab to see the molecular structure, such as the ribosomes. This is true, because the ribosomes are around 20 nm, which equates to about a 1/16 of a centimeter on the screen. They way I’d written the code used the Movie Clip as the rollover (rather than having it be a button with a hit state), so what I did was to add a larger square over each ribosome to increase the area that could be rolled over. Then I made the larger square transparent, so that it would be invisible in the final published version.

However, the worst problem was (and still is) the issue of embedding the SWF in an HTML page. Before doing this, the SWF was accessible on its own as a “shockwave object,” by following a link from my website, or the user could go directly to it. The problem with this was that if the user had a previous version of Flash Player than 9, it would not read Actionscript 3.0, and while the timeline would play, all scripts would be ignored. The result was a terrible jumble of looping, zooming, flashing drawings and tables. Yikes! So, clearly it was necessary to embed it in an html page that could detect the user’s version of Flash Player, and if it’s lower than 9, provide alternative content and a link to upgrade the version or download it if no flash player is present at all.

And this I did, using the swfobject code generator and download of a javascript file. Easy! Finally, something that is straight-forward and painless. Or so I thought.

But, then people started complaining about having to scroll up and down to access all of the necessary navigational buttons. This is a big problem. The first thing we learned about web design is to avoid making users scroll; personally, I hate having to scroll. Because there is no way to be able to predict how large every potential user’s browser window will be, I wanted to make the SWF resize in such a way that it will always be 100% visible regardless of the size, and maintain its aspect ratio (not to stretch/distort).

There are options that look like they would do that inside of the code generator at the swfobject site, but including them had no effect on my resulting html page. There were a few hints that something would have to be modified from within the FLA, so I found out the parameter for this (SHOW_ALL), and added it. And having added this condition to the FLA, it worked in Safari, after I changed the dimensions I was entering from actual pixel size to 100% for both width and height. But this caused Firefox to display nothing, just background color.

Obviously, not all users will be using Safari. In fact, only 3% of users are, while Firefox has about 46% and various versions of Internet Explorer have about 43%. I was kinda neutral on Safari as a browser before, but now it’s my favorite because it’s the only one that will listen to a damn thing I say. But not so with Firefox, and I don’t even know what would happen with Internet Explorer, because they don’t make a version for Mac OSX, which is my operating system. Looking for these statistics, I discovered a new browser I hadn’t even heard of, called Chrome (from Google—I’d probably like it actually). Will it display my content? Will the content resize under the conditions I have? I will be finding out, I guess!

Anyway, I read all of the FAq’s, and I couldn’t find the answer to the resizing issues I was having. I went to the “discussion” tab to ask about it, and they told me to get lost.
“What you want to do involves a combination of HTML parameters (whether you
are using SWFObject or not) and internal flash methods. I would suggest that
a general Flash forum / online tutorials would be your best FIRST point of
call on getting your swf to behave as you want, and then we can help if
there are specific HTML parameters / issues you are having embedding your
flash file on your page with SWFObject (e.g. Firefox requiring extra CSS to
display 100% sized flash files).

Respectfully, we try to keep these lists very narrow to deal with issue just
centred around SWFObject issues and bugs, and you will find more available
help elsewhere for general flash questions.

Kind regards,”
(-name omitted-)

I know he wasn't trying to be a jerk, but I don’t understand why he didn’t think I was asking about “specific HTML parameters / issues you are having embedding your flash file on your page with SWFObject (e.g. Firefox requiring extra CSS to display 100% sized flash files).” They said that they “can help” with those issues. Here’s what I asked:

“Which scale parameter should I choose? I thought that "showall" sounded like it would work, but it doesn't seem to be doing anything, because adding it has no effect. I am testing in FF and Safari.”

Clearly they don’t understand that my presentation is in a matter of days. Clearly, stating upfront that I didn’t have much development experience was a mistake. Take home message: never give anyone any reason to doubt you.

Apr 10, 2009

The Protein Data Bank for medical illustrators.

Proteins: they have an unbelievable range of functions, and each function relates directly to their shape and size. The Protein Data Bank provides extensive information about the structure. But what about the size? This blog entry will address one of the features provided by the PDB for visualizing proteins, and show you can use it to get the size info.

Let’s start with a molecule that may be familiar: kinesin. Kinesin is a protein that “walks” along microtubules, carrying vesicles and other organelles along with it. It is a dimer with two globular heads that bind to the tubulin subunits, each with a neck linker that catalyzes ATP, and a long helical chain with an organelle-binding domain at the top. The molecule is about 30 nm tall altogether (I read most of that in this book: Bittar, E. E. (1991). Structural biology (1st ed.). London, England: JAI Press LTD; some of it was told to me in a cell biology class here at UIC).

The PDB can be accessed at http://www.pdb.org . Going to “advanced search” and entering the word Kinesin, with the query type “molecule name” yields 23 structure hits. The PDB tends to break complicated molecules like kinesin down into their functional subunits, and I was not able to find a crystal structure for the entire kinesin molecule. Additionally, confusion can arise from the availability of mutated structures to view. So, use caution in selecting which entry to use as a reference. The abstract from the original article is linked to the PDB, so if you’re not sure about the structure, read that for more information.

I chose the structure “2kin” which is the structure of part of a monomer of rat kinesin. It is the neck and globular head domain. Jmol: takes you a page with an embedded JAVA applet. The molecule, by default, is shown with the ribbon model. This model can be rotated by dragging with the left mouse button. The mouse wheel enables zooming in and out; hovering reveals a text box telling you which amino acid residue you are hovering over.


Now for the exciting part: the right-click functions. There are many features here, and I’m just going to go over the ones that, at first glance, seem most useful to the scientific artist community. One of these menu items is Save with the option to create a JPEG or PNG, or – 3 D modelers, take notice—a VRML or Maya 3D model. I haven’t yet tried bringing either of these into 3DS Max or Maya, but it may prove to be fast and convenient.

As for size info, this can be obtained pretty painlessly. Here’s how: right-click, go to Measurements > Distance units nanometers. Then, right-click and choose “Click for distance measurement.” You can still left-click and drag to rotate. Once you pick the dimension you want to measure, just click once at one location, and again at the other location. A dashed line will be drawn from the first point to the second, and the distance between them will be displayed in white text, in nanometers. (The nanometer is the unit of choice for me, when talking about protein dimensions like these. The Angstrom is something of an out-dated term, and picometers will usually be quite a high number because they are very small units, at 10^-12.) In this case, measuring two points at the widest part of the globular subunit reveals that it is 6.4 nm wide. Easy, right?

And now for the weird part: right click and choose Style>Stereographic>Cross Eyed Viewing. This splits the image into two views, and I kid you not, if you cross your eyes and play around with the distance your head is away from your monitor, you will see a 3D image, that can be rotated by clicking and dragging. It’s kinda like those Magic Eye posters from the 90’s, only with those I know you were supposed to look “through” them. Good times.

I hope this entry has given you a useful tool for your workflow; I know it will fit right in to mine.

Feb 10, 2009

Human Subjects

The Flash interactive I am making is meant for a purpose, and that purpose is to be a visual reference, especially for medical and scientific illustrators, that can provide them with answers to questions about microscopic size relationships. The only way to find out if it is accomplishing its goal is to ask them if it is working.

In order to get off to the best start, I have sent out some surveys to find out how much of a need there is for such a reference, as well as to get feedback from members of the target audience. So a big thank you! to everyone who has responded. Already, the feedback is helping me to target my efforts in the right directions. For example, the surveys are indicating that medical illustrators want to see molecular structure. Based on this finding, I have added an area to the "Organelles" tab to display molecular structures of organelles, such as showing DNA when the user rolls over the nucleus.

After more of the project is established, I will open up a web-based survey for all users. This will hopefully tell me information about how usable the site is, and give people a way to give feedback.

Coming soon: a tutorial on molecular structure visualization. There are a lot of free programs out there that can display molecular structure. The choices can be a little overwhelming at first. I am going to compile a list of them, and what to expect when using them.

Jan 23, 2009

Surprise, surprise

Due to the complexity and smallness of the organelles inside the cell, I thought I should devote a whole tab in the interactive to describing them visually. I decided to start with an organelle that I expected to be easy: the mitochondrion. It turns out, since the late 1990's, there has been a revolution in the way that people think of mitochondria.

In the 1950's, the transmission electron microscope became a fashionable tool for inspecting cells, and it allows extremely high resolution, but the problem is that it can only examine a very thin slice of the cell. A problem arose when trying to determine the 3D structure from 2D information. There were two cytologists who were simultaneously trying to describe mitochondria. Dr. Sjostand had a more painstaking tissue fixation technique, while Dr. Palade didn't believe that the conditions of fixation were important. Their observations led them to different conclusions about the morphology of mitochondria. Dr. Sjostand insisted that the foldings of the inner membrane (called cristae) were only continuous with the rest of the membrane in very small areas, while Dr. Palade beleived that they were like the baffles of an accordion, and were continuous with the inner membrane over large spaces.

While they both agreed that Dr. Sjostand's micrographs were better, and Dr. Sjostand's fixation method has become universally adopted, Dr. Palade's baffle model was the one to become widely accepted, and it is still in most textbooks today. It wasn't until the late 1990's, when microscopy techniques were developed that allowed the examination of thicker slices of cells, that people noticed that mitochondria look nothing like Dr. Palade's model, and Dr. Sjostand was more correct about mitochondrial internal structure. The cristae are tubular in the cells of almost all tissues, and are indeed only connected to the inner membrane by small round openings, now termed "crista junctions."

But what about the external structure and overall morphology? Better microscopy has revealed that mitochondria are not usually isolated, bean-shaped entities, floating in the cytosol, but that they form a dynamic network of interconnected mitochondria that are constantly coming together and separating, based on energy demands of the cell. Also, they associate closely with the endoplasmic reticulum.

Because this information about mitochondria took me by surprise, I have decided that a good deal of reading must be done before I can draw any organelle, because I want my interactive to have the most up-to-date and accurate pictures, and not to show the generic, formulaic representations that I have been seeing all my life. So, don't be surprised if you see something represented in a way that you are not used to seeing it.

The interactive will be online soon, although this business with the mitochondria and other organelles has slowed me down somewhat...But I think it is better to do more research and invest more time in the beginning, than to have to go back and make changes later.

Jan 16, 2009

What color is a cell?


Because most cells are invisible to the naked eye (with some exceptions, like the chicken egg which is all one giant cell) the scientific artist has to choose what color to make them. For the illustrations of cells in my project, I am going to use a color palette derived from pictures of cells that are stained with H & E, or hematoxylin and eosin. This combination of dyes is very often used to visualize cells for light microscopy. In fact, at a previous job, I personally spent many an hour in the lab at a microscope counting H&E-stained lung cells. Because of this tradition, it seemed like an appropriate choice for use in my project.

Click here to see a picture of cells stained with H&E. To make a long story short, hematoxylin is a dark blue-purple dye that is basic. It stains regions rich in DNA and RNA, such as the nucleus and ribosomes. Eosin is bright pink, and stains cytoplasmic protein.

For my illustrations, I created this palette by using the eye-dropper tool in Photoshop to sample the various colors from a few examples of H&E photomicrographs. The colors on the left are used for the color inside the cells, the second row is used for the stroke defining the edges of the cells, as well as organelles and details inside. The 3rd row is for the nucleus, and the last row is for highly eosinophilic structures like erythrocytes, or the bright pink spheres inside an eosinophil, which is what gives them their name.

Jan 13, 2009

Custom Brushes in Illustrator

As I drew the sketches of the cells that will go into my Flash site and began working in Illustrator to make them into vector art, I had a few ideas about a technique to help speed things along. Here, I want to share a tutorial on making custom brushes in Illustrator. Specifically, the ribosomes typically appear, at a scale of 10,000X, to be small 1pt dots, distributed throughout the cytoplasm or attached to the rough endoplasmic reticulum. This brush will create a regular pattern of dots that follow the path of the brush.
  1. Make a 1pt dot using the ellipse tool.
  2. Convert it to a symbol by selecting it, and going to the menu inside the symbols tab, and click "new symbol."
  3. With the dot selected as the symbol, use the symbol sprayer to spray a bunch of dots out. Make it look natural and not too regular or patterned.
  4. Select the field of dots and go to Object > Expand. The default will have "object" and "fill" selected, which is fine: say OK.
  5. Remove any unwanted dots. It's probably a good idea to keep them within a square area to avoid a stamped look later. Individual dots can now be moved around to your liking.
  6. With your square of dots selected, enter the menu of the brushes tab and select "new brush."
  7. You will have 4 options. The first, New Calligraphic Brush, doesn't allow you to use the pattern, so forget about this one.
  • New Scatter Brush - this option will create a brush that will repeat the selected pattern exactly without any distortion. The number of repeats is based on the length of the path, but it will be no fewer than one stamp of it (i.e. it will not be shrunk or cut in half). Thus it is a good option for this purpose, as long as the path is straight. Otherwise you get a tiled, stamped look. It just happens to be the first thing I tried, and it works, but lets have a look at the other choices, just out of curiosity.
  • New Art Brush - Takes the pattern of dots and stretches it out to fit the path. This causes distortion and differences in the size and shape of the dots. Hence, it is not a good option for this purpose.
  • New Pattern Brush - creates a brush that is like a cross between the scatter and art brushes, in that it repeats the pattern and conforms it to the path with minimal (but still present) distortion. So, not a terrible option for our purposes.
Now after I have drawn the cell's outline and other organelles, I can use brushes made in this way to distribute ribosomes throughout the cell in a fraction of the time it would have taken me to paste or draw them in, and with more predictability than I would have had by using the symbol sprayer. Next I hope to make a brush that can automate the drawing of the endoplasmic reticulum and golgi apparatus, which typically appear in cross-section as a series of flattened sacs or elongated ovals.

Jan 8, 2009

Phases of the Project

My favorite "beta-version" of the interactive got a face-lift over my Christmas break, and I have decided that I am ready to move on to the next part of my project: adding content.

My technique for drawing the cells: The first part of the interactive I will be adding content to is the "Cells" tab. I have begun drawing all of the cells that will be shown at the exact same scale, such that 1 micrometer (or micron, or um) is equal to 1 cm. This corresponds to a magnification of 10,000 X. I have a large pad of sketch paper, and on one sheet of it, I drew a 1 cm grid. This, I place underneath a blank sheet of the same paper, so that when I am drawing the cells, I can simply count off the squares to know exactly what the dimensions should be.

So far I have drawn:
  • some red blood cells
  • a sperm cell
  • two columnar epithelial cells
  • a squamous epithelial cell
  • some bacteria
  • some yeast

Before today, I didn't know quite how interesting-looking yeast is. Check out this link for yeast and other cool pictures from the kingdom Fungi: http://io.uwinnipeg.ca/~simmons/16cm05/1116/16fungi.htm .